
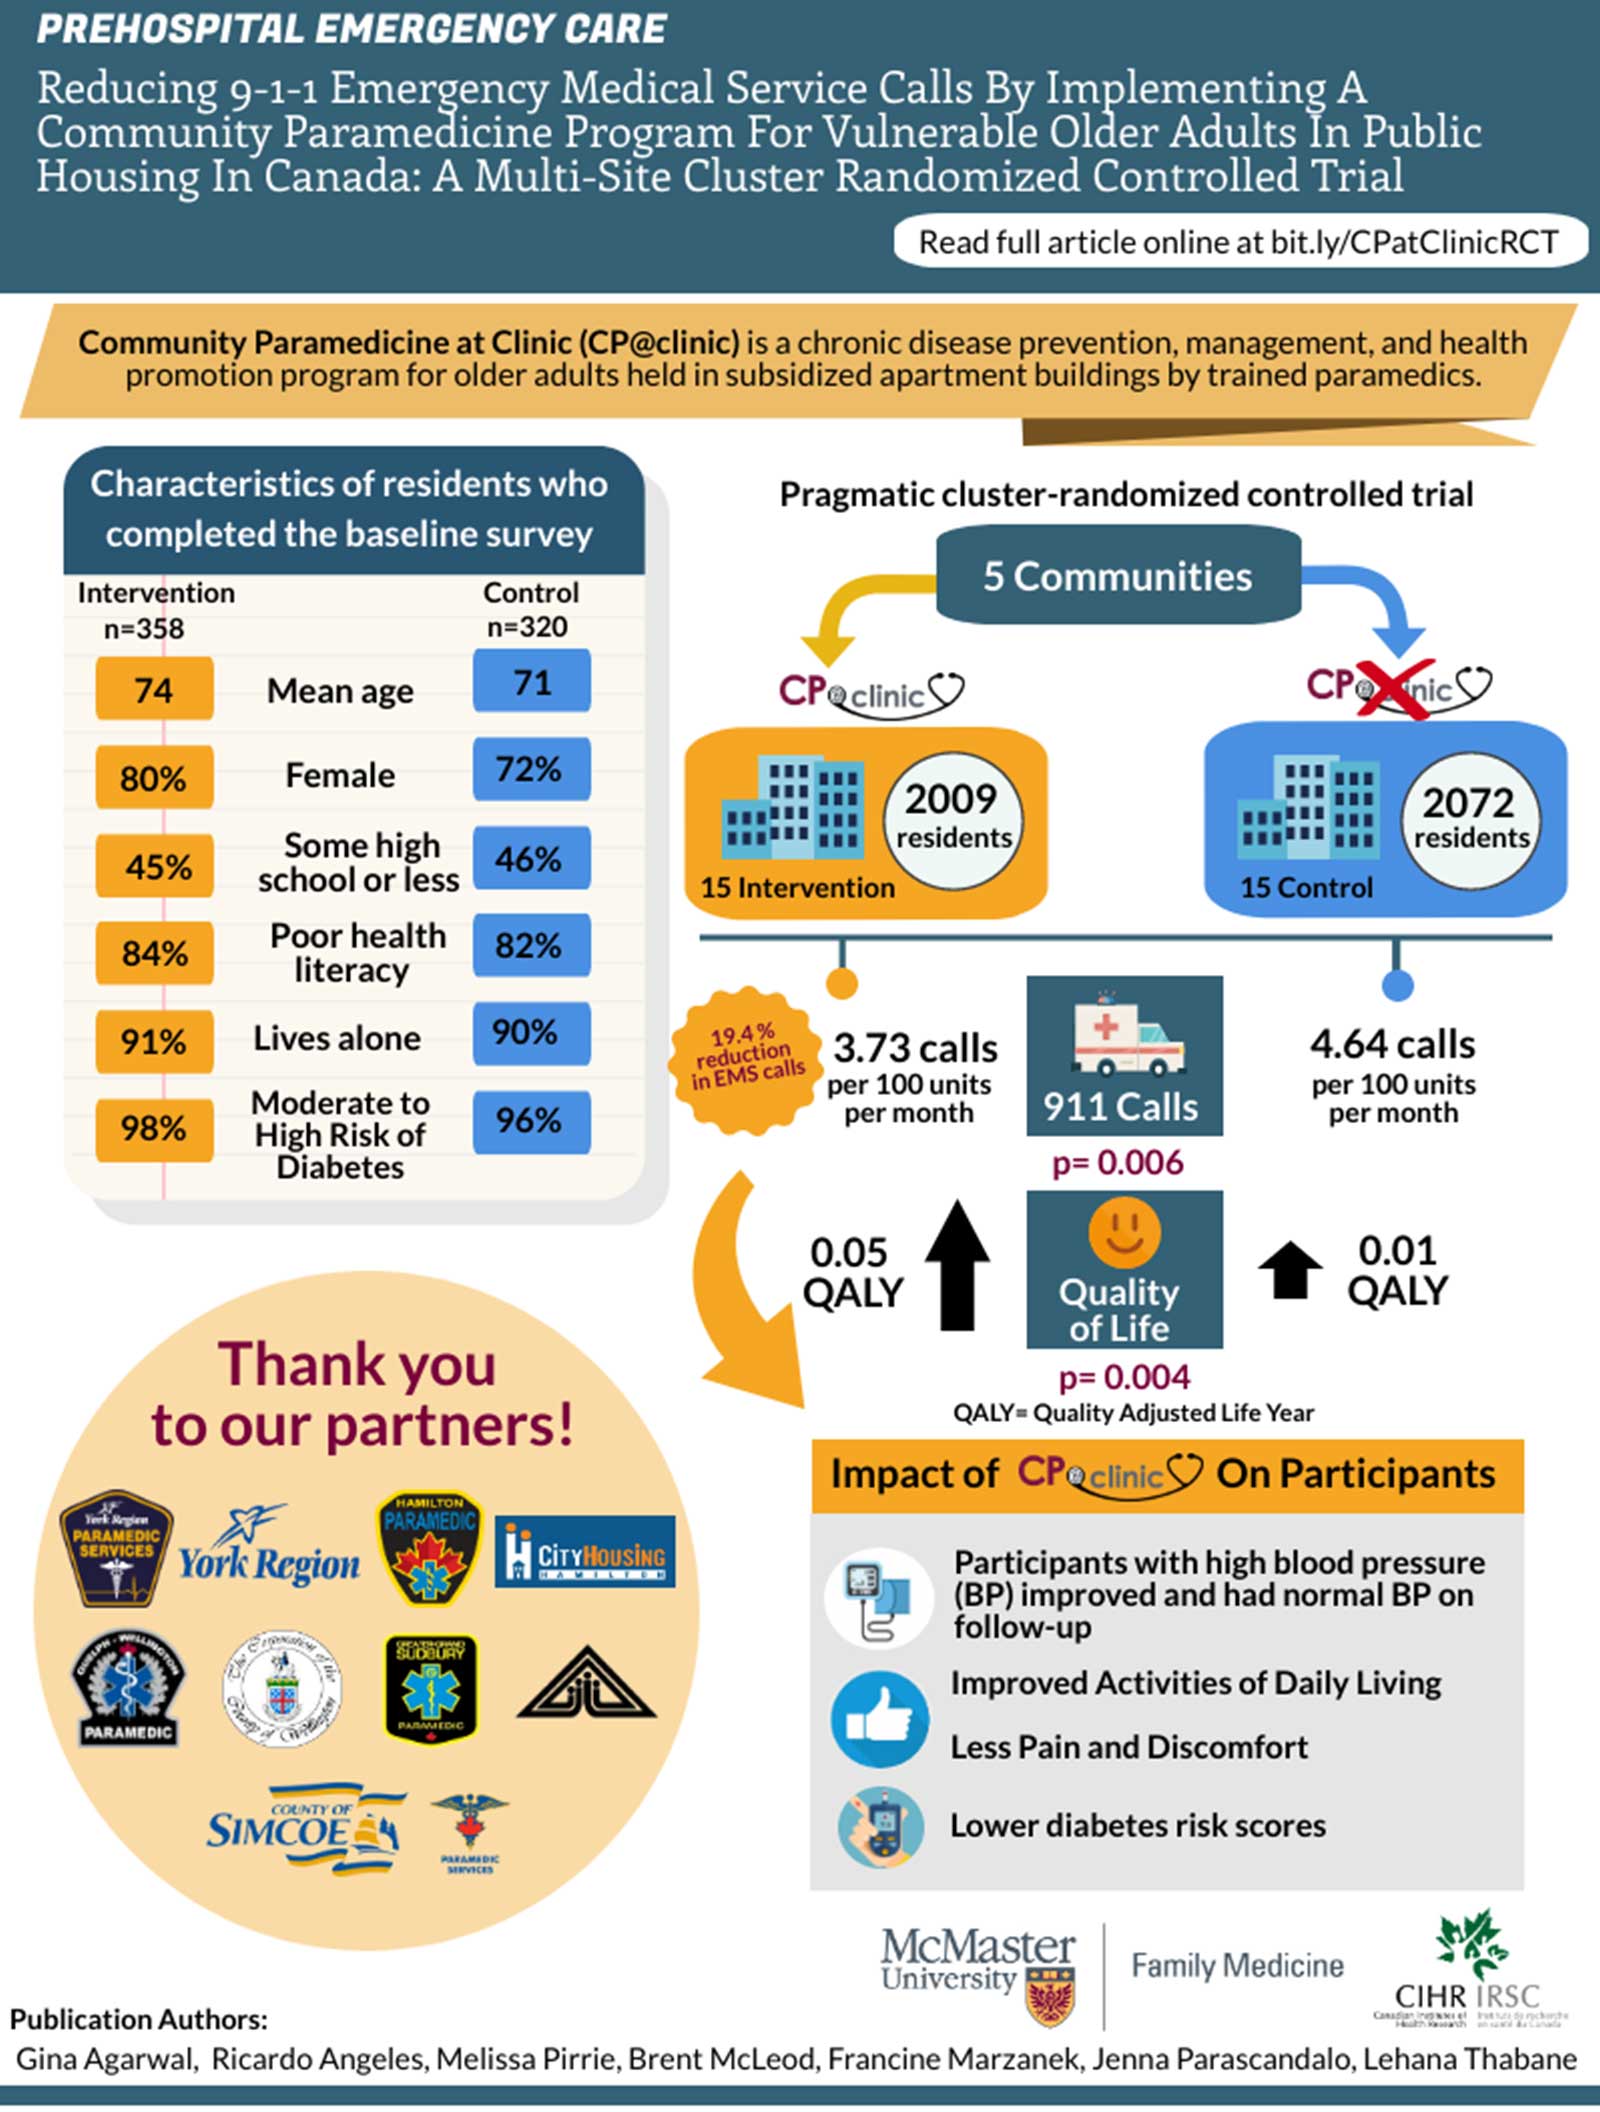
Infographic explaining the published article from the VIP Lab in Prehospital Emergency Care. The top banner has text that says Prehospital Emergency Care. Reducing 9 1 1 emergency medical service calls by implementing a community paramedicine program for vulnerable older adults in public housing in Canada. a multi site cluster randomized controlled trial. Read full article online at bit dot ly forward slash CP at Clinic RCT. Below the title banner is a smaller banner that has text which says Community Paramedicine at clinic or CP at clinic is a chronic disease prevention, management, and health promotion program for older adults held in subsidized apartment buildings by trained paramedics. Below this banner is a number of graphics and statistics. On the top left of that space below the banner is a box titled characteristics of residents who completed the baseline survey. On the left of the box is a column labelled Intervention n equals 358 and on the right is a column labelled Control n equals 320. The statistics organized in these columns are labelled as follows from top to bottom. Mean age is 74 in intervention, 71 in control. Female is 80 percent in intervention, 72 percent in control. Some high school or less is 45 percent in intervention, 46 percent in control. Poor health literacy is 84 percent in intervention, 82 percent in control. Lives alone is 91 percent in intervention, 90 percent in control. Moderate to high risk of diabetes is 98 percent in intervention, 96 percent in control. Below this box of characteristics is a bubble with text at the top of it that says thank you to our partners. Under the text are logos for the following services from left to right, top to bottom. York region paramedic services, York region, Hamilton paramedic services, city housing hamilton, guelph wellington paramedic services, the corporation of the county of wellington, greater Sudbury paramedic services, Sudbury housing, The County of Simcoe, and county of Simcoe health and emergency services. On the right side of the infographic is a diagram showing the flow of the project from study methods at the top to study results at the bottom. The top has text that says pragmatic cluster randomized controlled trial. Below this is a box that says 5 communities and has two arrows branching away from it. One arrow branches to the left and down, and the other branches to the right and down. The arrow on the left points to the CP at clinic logo, an icon of apartment buildings, and text that says 15 intervention, 2009 residents. The arrow on the right points to the CP at clinic logo with an X overlaying it, an icon of apartment buildings, and text that says 15 control, 2072 residents. Below all these icons and text is a horizontal line with a vertical branch pointing down from the text that says 15 intervention, and a vertical branch pointing down from the text that says 15 control. Below the branch from 15 intervention there is a bubble that says 19.4 percent reduction in EMS calls and text that says 3.73 calls per 100 units per month. Below the branch from 15 control is text that says 4.64 calls per 100 units per month. Between the two branches is an icon of an ambulance with text that says 911 calls and text that says p equals 0.006. Below the text that says 3.73 calls per 100 units per month is text that says 0.05 QALY and an icon of an arrow pointing up. Below the text that says 4.64 calls per 100 units per month is text that says 0.01 QALY and an icon of a smaller arrow pointing up. Between the two arrows pointing up is a smiley icon with text that says quality of life and text that says p equals 0.004. Below that is text that says QALY equals Quality adjusted life year. There is a large arrow pointing from the bubble that says 19.4 percent reduction in EMS calls to a box that is titled Impact of CP at clinic on participants. In the box there is an icon of a blood pressure cuff and text that says participants with high blood pressure or BP improved and had normal BP on follow up, a thumbs up icon with text that says improved activities of daily living, less pain and discomfort, and an icon of a hand holding a handheld glucometer with text that says lower diabetes risk scores. Below this box is the logo for the McMaster University Department of Family Medicine and the logo for the Canadian Institute of Health Research. The bottom of the infographic has text that says Publication authors which are Gina Agarwal, Ricardo Angeles, Melissa Pirrie, Brent McLeod, Francine Marzanek, Jenna Parascandalo, Lehana Thabane.
Download
