
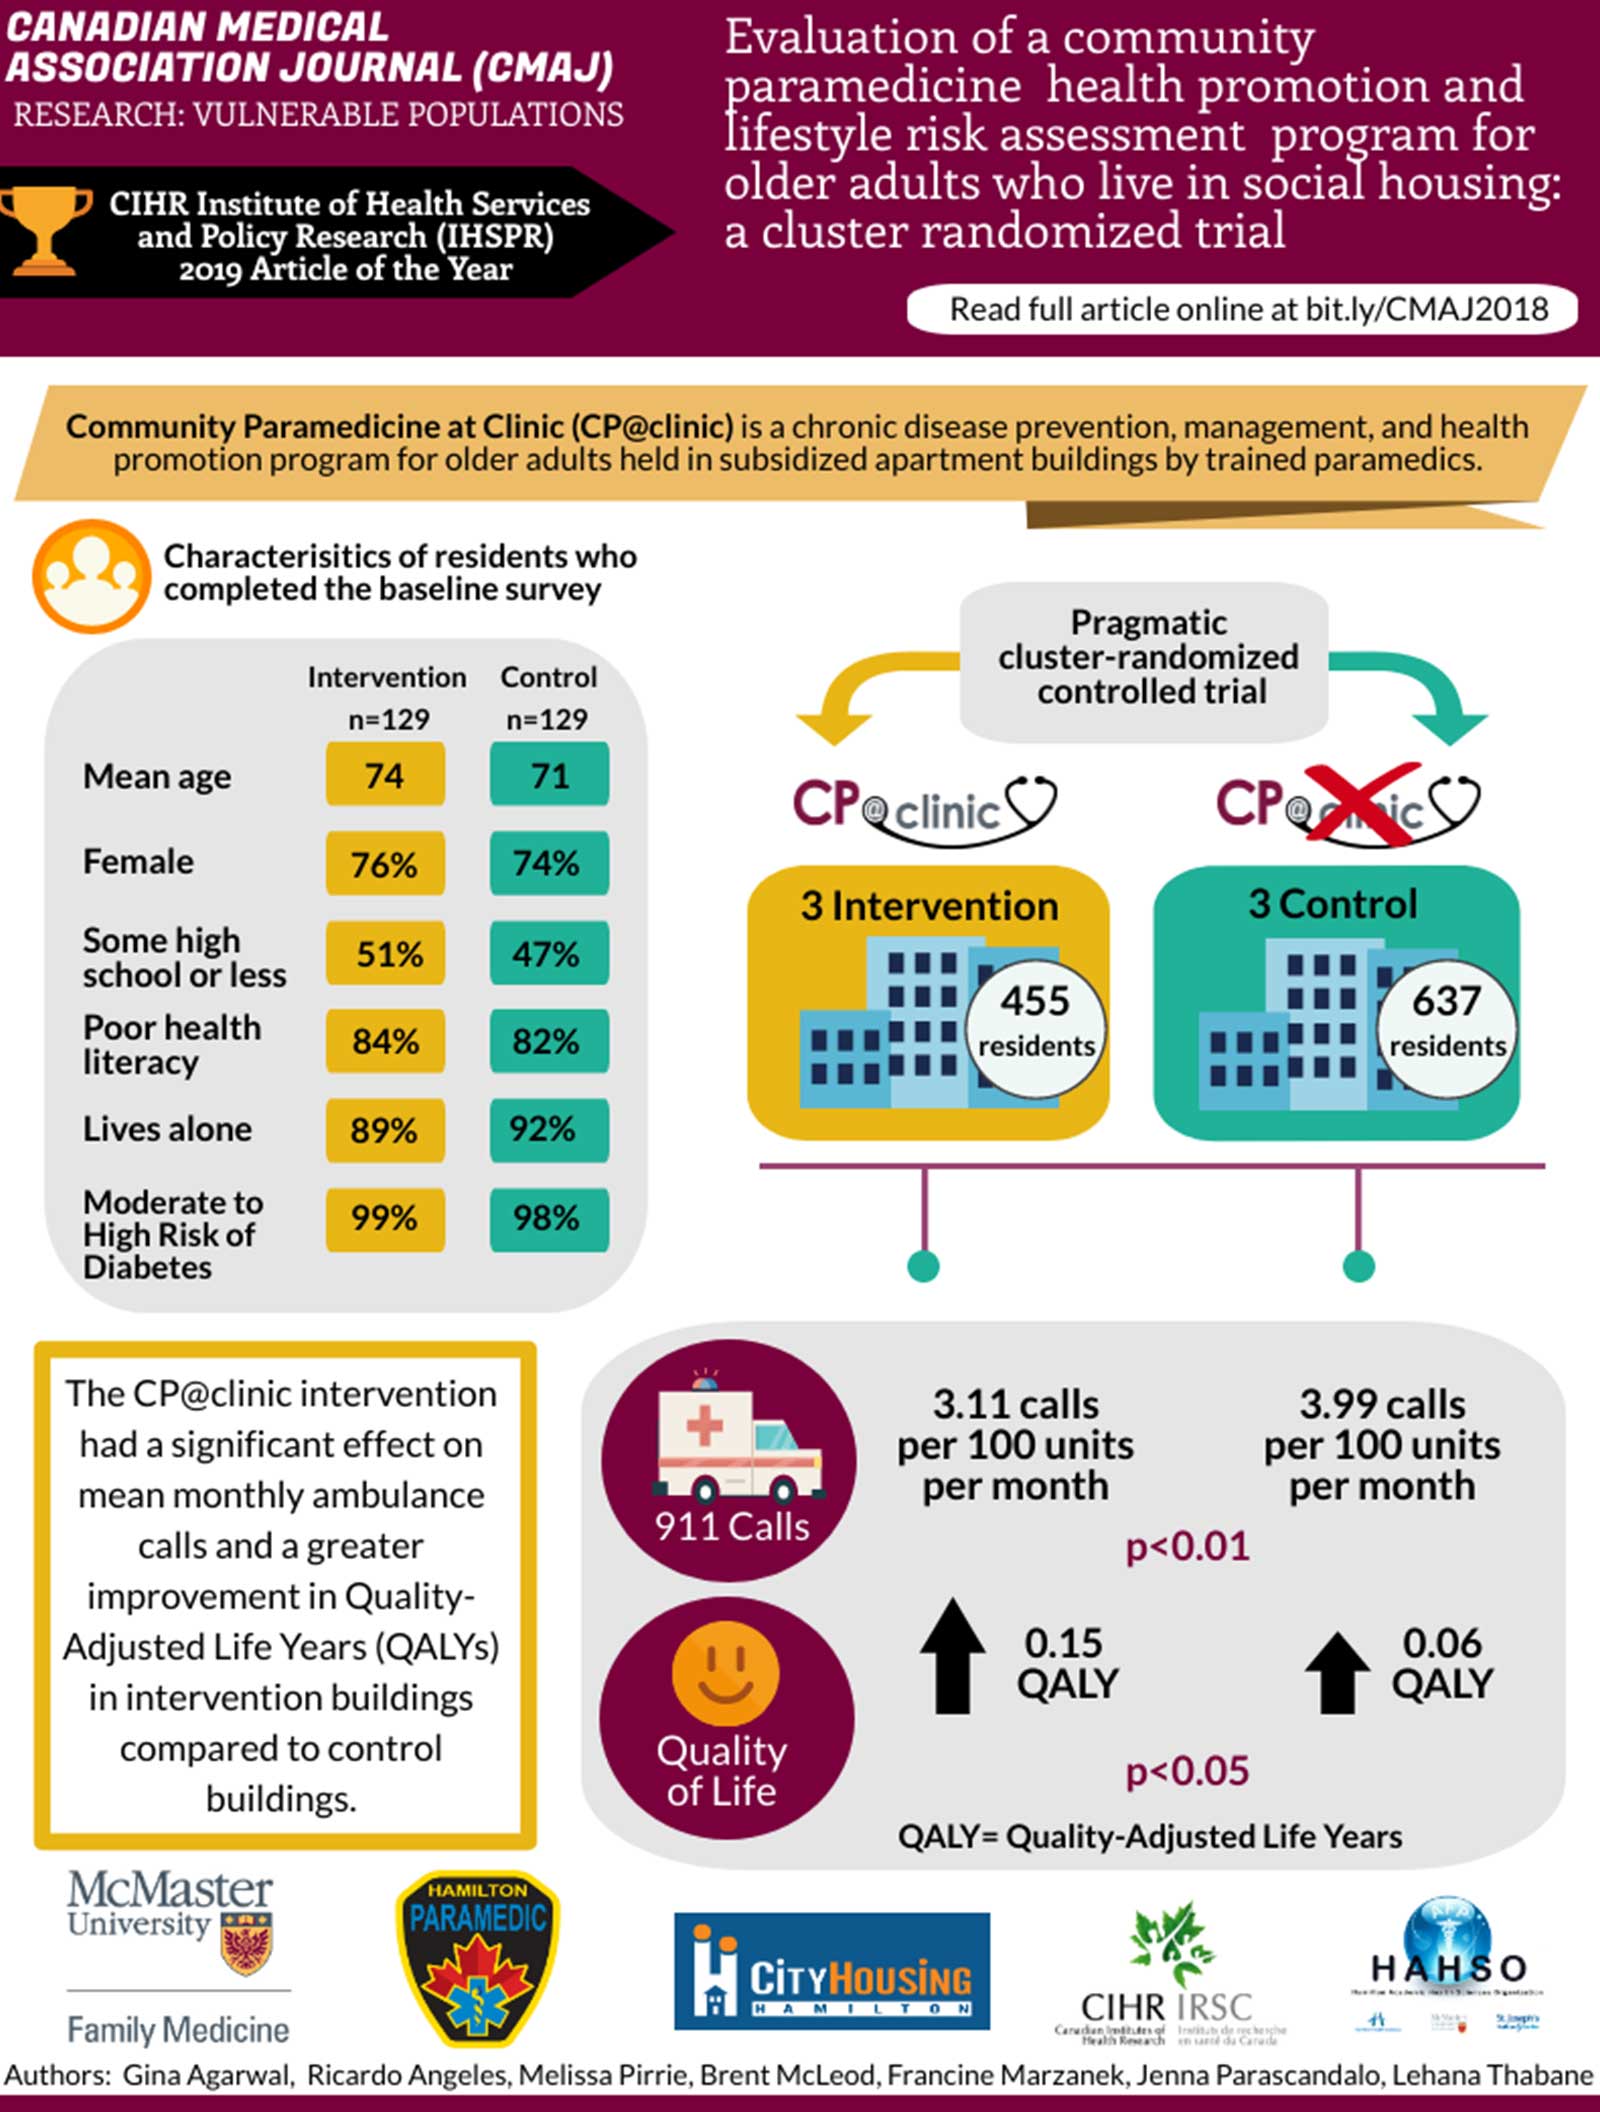
Infographic on the 2018 publication from the VIP Lab in the Canadian Medical Association Journal, or CMAJ. On the top left is text that says Canadian Medical Association Journal CMAJ Research. Vulnerable populations. Below this is an icon of a trophy and text that says CIHR Institute of Health Services and Policy Research IHSPR 2019 Article of the year. At the top right is the title of the article, which is Evaluation of a community paramedicine health promotion and lifestyle risk assessment program for older adults who live in social housing, a cluster randomized trial. Below this says read full article online at bit dot LY forward slash CMAJ2018. Below the title banner is another banner that reads Community paramedicine at clinic or CP at clinic is a chronic disease prevention, management, and health promotion program for older adults held in subsidized apartment buildings by trained paramedics. Below this banner to the left is a title that says characteristics of residents who completed the baseline survey. The demographics are divided by Intervention n equals 129 and Control n equals 129. The demographics listed are as follows. 74 is the mean age in Intervention, 71 in control. 76 percent of intervention and 74 percent of control are female. 51 percent of intervention and 47 percent of control have some high school or less. 84 percent of intervention and 82 percent of control have poor health literacy. 89 percent of intervention and 92 percent of control live alone. 99 percent of intervention and 98 percent of controls have moderate to high risk of diabetes. Below these demographics is text that says the CP at clinic intervention had a significant effect on mean monthly ambulance calls and a greater improvement in Quality Adjusted Life years or QALYs in intervention buildings compared to control buildings. To the right of the demographics and this text is a diagram showing the flow vertically from study results to methods. At the top, text says pragmatic cluster randomized controlled trial. From this text there are two arrows. One arrow branches to the left and down and the other to the right and down. On the left the arrow points to the CP at clinic logo, text that says 3 Intervention, and an icon of 3 apartment buildings overlaid with text that says 455 residents. On the left, the arrow points to the CP at clinic logo with an X over it, text that says 3 Control, and an icon of 3 apartment buildings overlaid with text that says 637 residents. Under these diagrams is a horizontal line with two vertical branches, one directly beneath each icon of 3 apartment buildings. Beneath these branches is a box with a summary of results. On the top far left of the box is a bubble with an icon of an ambulance with text that says 9 1 1 calls, and under that is a bubble with an icon of a smiley face and text that says quality of life. Directly below the branches reaching from the 3 Intervention building apartment icons and 3 Control building apartment icons is text that says, respectively, 3.11 calls per 100 units per month and 3.99 calls per 100 units per month. Between these two results is text that says p less than 0.01. Below these results from left to right, beside the quality of life icon and smiley, is an arrow pointing upward and text that says 0.15 QALY, text that says p less than 0.05, and an arrow pointing upward that says 0.06 QALY. At the bottom of the box says QALY equals Quality adjusted life years. Across the bottom of the infographic from left to right are the logos for the McMaster University Department of Family Medicine, Hamilton Paramedic Services, City Housing Hamilton, the Canadian Institute for Health Research, and Hamilton Academic Health Sciences Organization. Below these logos is text that says author names, which are Gina Agarwal, Ricardo Angeles, Melissa Pirrie, Brent McLeod, Francine Marzanek, Jenna Parascandalo, Lehana Thabane.
Download
